Sphere with Shells
This section presents a model composed of a sphere with two concentric shells. We use the model to explore answers to the following questions:
- What compute time is required to create successively refined resolutions in
automesh? - What compute time is required to create these same resolutions in Sculpt?
- Given a rotational boundary condition, what are the displacement and strain fields for the voxel mesh?
- How do the results for the voxel mesh compare with the results for a conforming mesh?
- To what degree may smoothing the voxel mesh improve the results?
- To what degree may dualization of the voxel mesh improve the results?
Model
Python is used to create a segmentations, saved as .npy files, and visualize the results.
Given
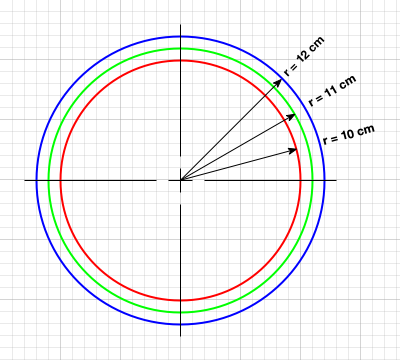
Given three concentric spheres of radius 10, 11, and 12 cm, as shown in the figure below,

Figure: Schematic cross-section of three concentric spheres of radius 10, 11, and 12 cm. Grid spacing is 1 cm.
Find
Use segmentation resolutions 1, 2, 4, and 10 voxels per centimeter
with a cubic domain (nelx = nely = nelz) to create finite element meshes.
Solution
| vox/cm | element side length (cm) | nelx | # voxels | segmentation | file size |
|---|---|---|---|---|---|
| 1 | 1.0 | 24 | 13,824 | spheres_resolution_1.npy | 14 kB |
| 2 | 0.5 | 48 | 110,592 | spheres_resolution_2.npy | 111 kB |
| 4 | 0.25 | 96 | 884,736 | spheres_resolution_3.npy | 885 kB |
| 10 | 0.1 | 240 | 13,824,000 | spheres_resolution_4.npy | 13.78 MB |
Python Segmentation
The Python code used to generate the figures is included below.

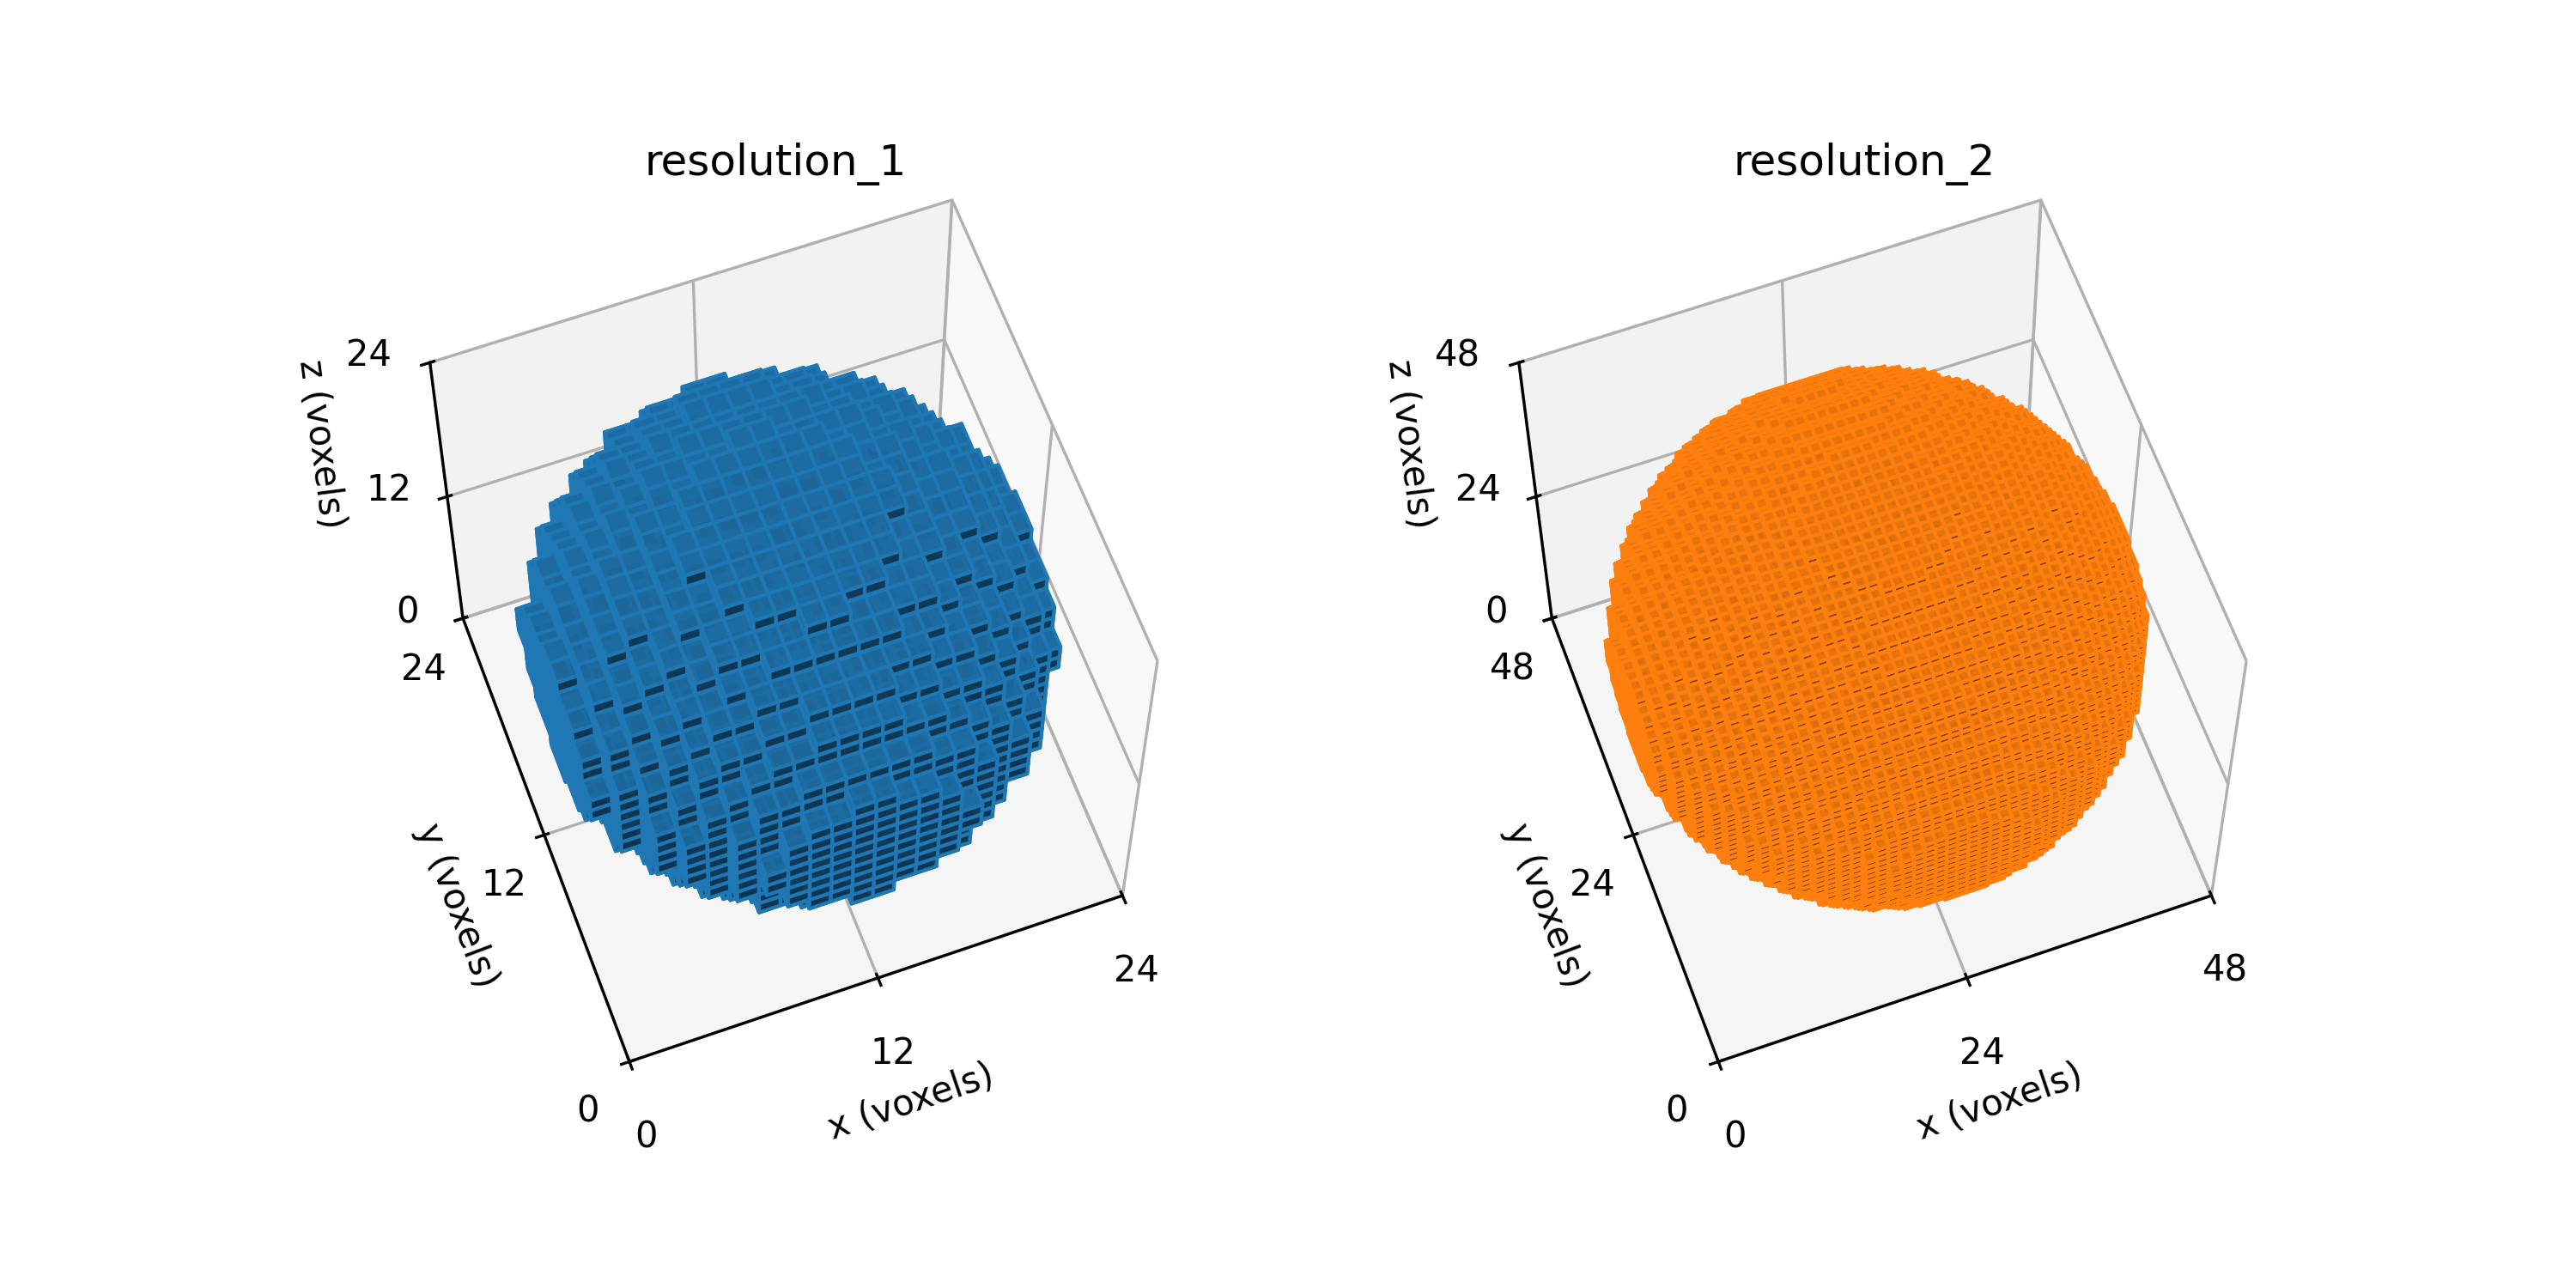
Figure: Sphere segmentations (left) spheres_resolution_1.npy and (right) spheres_resolution_2.npy shown in the voxel domain.
Because plotting large domains with Matplotlib
is slow, only the first two resolutions are shown.

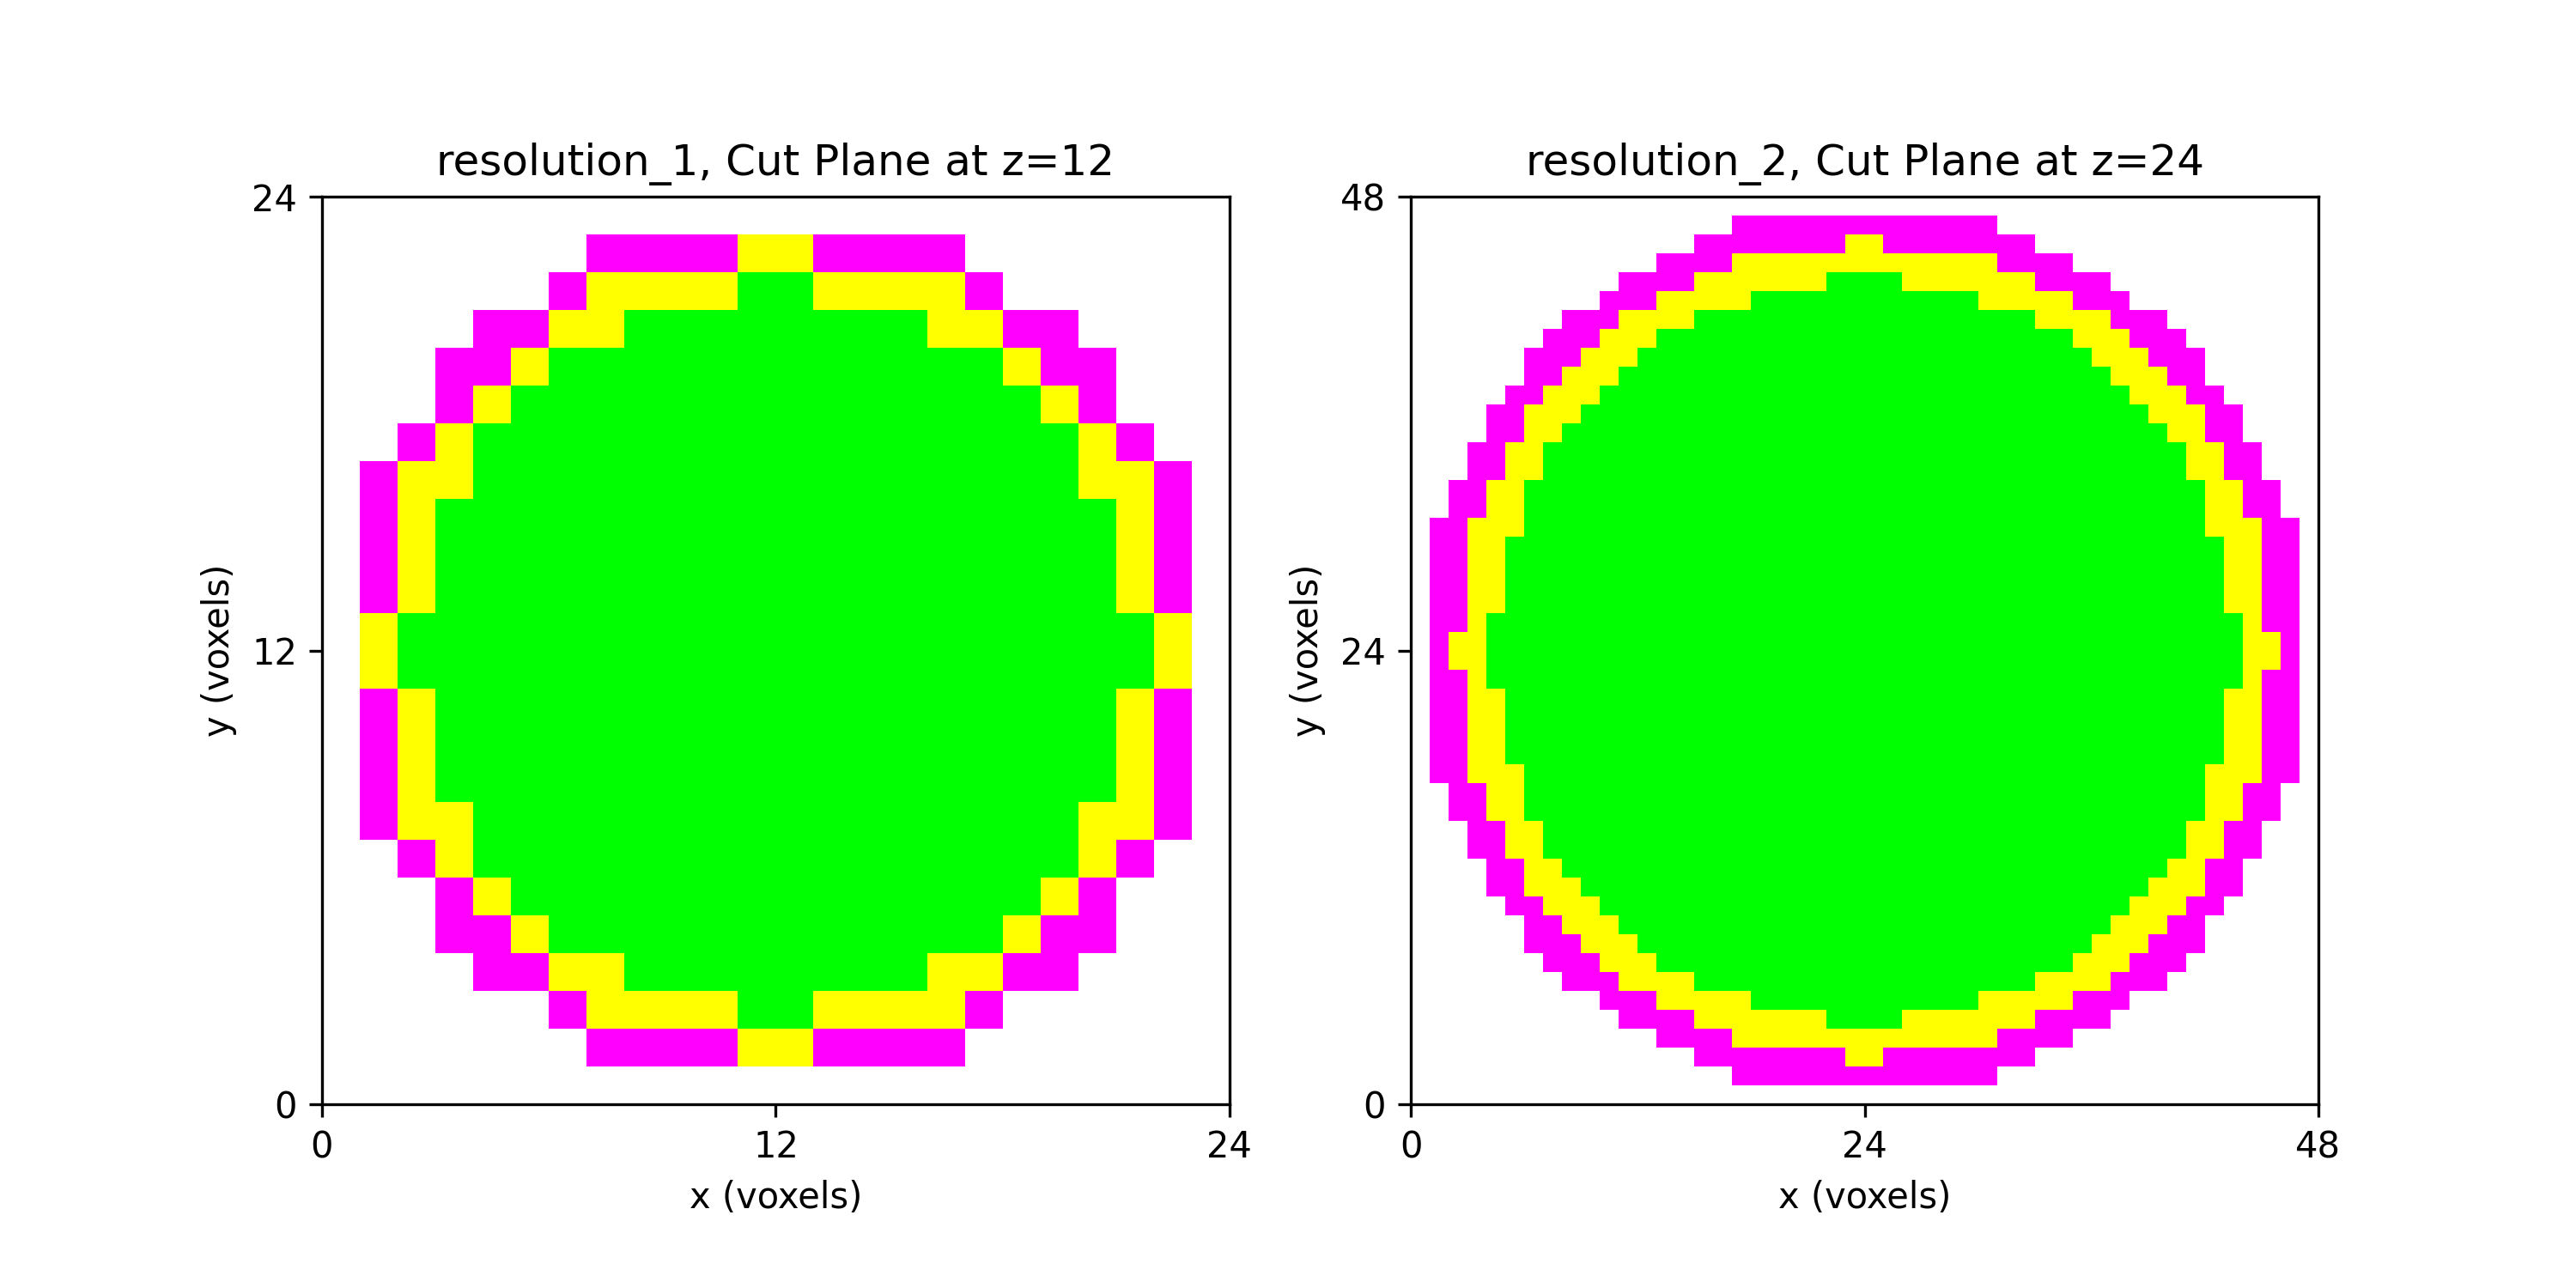
Figure: Sphere segmentations with cutting plane of (left) spheres_resolution_1.npy and (right) spheres_resolution_2.npy.
Source
spheres_cont.py
r"""This module, spheres_cont.py, builds on the spheres.py module to create
high resolution, three-material, concentric spheres and export the
voxelization as a .npy file.

Example
-------
source ~/autotwin/automesh/.venv/bin/activate
python spheres_cont.py

Output
------
~/autotwin/automesh/book/analysis/sphere_with_shells/spheres_resolution_1.npy
~/autotwin/automesh/book/analysis/sphere_with_shells/spheres_resolution_2.npy
~/autotwin/automesh/book/analysis/sphere_with_shells/spheres_resolution_3.npy
~/autotwin/automesh/book/analysis/sphere_with_shells/spheres_resolution_4.npy
"""

from pathlib import Path
from typing import Final

from matplotlib.colors import LightSource, ListedColormap
import matplotlib.pyplot as plt
from mpl_toolkits.mplot3d import Axes3D
import numpy as np


# Visualize on a cutting plane
def plot_cutting_plane(ax, key, data, plane="z", index=None, cmap=None, alpha=None):
    """Plots a 2D cutting plane slice of a 3D dataset on the specified axis.

    This function visualizes a slice of the 3D data array along a specified
    plane (x, y, or z) and displays it using a 2D image representation. The
    slice can be specified by an index, and the appearance of the plot can be
    customized with a colormap and transparency level.

    Parameters
    ----------
    ax : matplotlib.axes.Axes
        The axes on which to plot the cutting plane.

    key : str
        A descriptive label for the dataset, used in the plot title.

    data : numpy.ndarray
        A 3D numpy array representing the voxelized data. The shape of the
        array should be (depth, height, width) corresponding to the
        z, y, and x dimensions.

    plane : str, optional
        The plane along which to slice the data. Can be 'x', 'y', or 'z'.
        Default is 'z'.

    index : int, optional
        The index of the slice to visualize along the specified plane. If not
        provided, the function will default to the middle slice of the data
        along the specified plane.

    cmap : str or matplotlib.colors.Colormap, optional
        The colormap to use for visualizing the slice. If not provided,
        defaults to 'gray'.

    alpha : float, optional
        The transparency level of the plotted slice, where 0 is fully
        transparent and 1 is fully opaque. If not provided, defaults to 0.8.

    Returns
    -------
    None
        This function does not return any value. It modifies the provided axes
        to display the cutting plane visualization.

    Notes
    -----
    The function sets the x and y labels based on the specified plane and
    adjusts the plot title to include the key and the index of the slice.
    """
    origin = "lower"
    if cmap is None:
        cmap = "gray"
    if alpha is None:
        alpha = 0.8
    if plane == "z":
        if index is None:
            index = data.shape[2] // 2  # Middle slice
        slice_data = data[:, :, index]
        ax.imshow(
            slice_data,
            cmap=cmap,
            extent=[0, data.shape[1], 0, data.shape[0]],
            origin=origin,
            alpha=alpha,
        )
        ax.set_title(f"{key}, Cut Plane at z={index}")
        ax.set_xlabel("x (voxels)")
        ax.set_ylabel("y (voxels)")
    elif plane == "y":
        if index is None:
            index = data.shape[1] // 2  # Middle slice
        slice_data = data[:, index, :]
        ax.imshow(
            slice_data,
            cmap=cmap,
            extent=[0, data.shape[2], 0, data.shape[0]],
            origin=origin,
            alpha=alpha,
        )
        ax.set_title(f"{key}, Cut Plane at y={index}")
        ax.set_xlabel("x (voxels)")
        ax.set_ylabel("z (voxels)")
    elif plane == "x":
        if index is None:
            index = data.shape[0] // 2  # Middle slice
        slice_data = data[index, :, :]
        ax.imshow(
            slice_data,
            cmap=cmap,
            extent=[0, data.shape[2], 0, data.shape[1]],
            origin=origin,
            alpha=alpha,
        )
        ax.set_title(f"{key} Cut Plane at x={index}")
        ax.set_xlabel("y (voxels)")
        ax.set_ylabel("z (voxels)")


def sphere(resolution: int, dtype=np.uint8) -> np.ndarray:
    """Generate a 3D voxelized representation of three concentric spheres
    of 10, 11, and 12 cm, at a given resolution.

    Parameters
    ----------
    resolution : int
        The resolution as voxels per centimeter.  Minimum value is 1.

    dtype: data-type, optional
        The data type of the output array.  Default is np.uint8.

    Returns
    -------
    np.ndarray
        A 3D numpy array representing the voxelized spheres.  Voxels within
        the inner sphere are set to 1, the intermediate shell are set to 2,
        and the outer shell are set to 3.  Voxels outside the spheres are
        set to 0.

    Raises
    ------
    ValueError
        If the resolution is less than 1.
    """
    print(f"Creating sphere with resolution: {resolution}")
    if resolution < 1:
        raise ValueError("Resolution must be >= 1")

    r10 = 10  # cm
    r11 = 11  # cm
    r12 = 12  # cm

    # We change the algorithm a bit here so we can exactly match the radius:
    # number of voxels per side length (nvps)
    # nvps = 2 * r12 * resolution + 1
    nvps = 2 * r12 * resolution
    vox_z, vox_y, vox_x = np.mgrid[
        -r12 : r12 : nvps * 1j,
        -r12 : r12 : nvps * 1j,
        -r12 : r12 : nvps * 1j,
    ]
    domain = vox_x**2 + vox_y**2 + vox_z**2

    # sphere with radius 10, indicated with "1" and background as "0"
    mask_10_in = np.array(domain <= r10 * r10, dtype=dtype)  # segmentation "1"
    # sphere with radius 11, indicated with "1" and background as "0"
    mask_11_in = np.array(domain <= r11 * r11, dtype=dtype)
    # sphere with radius 12, indicated with "1" and background as "0"
    mask_12_in = np.array(domain <= r12 * r12, dtype=dtype)

    mask_10_11 = mask_11_in - mask_10_in  # intermediate shell
    mask_11_12 = mask_12_in - mask_11_in  # outer shell

    # mask_10_in is already the inner sphere, segmentation "1"
    shell_10_11 = 2 * mask_10_11  # intermediate shell, segmentation "2"
    shell_11_12 = 3 * mask_11_12  # outer shell, segmentation "3"

    result = mask_10_in + shell_10_11 + shell_11_12
    print(f"Completed: Sphere with resolution: {resolution}")
    return result


def main():
    """The main program."""
    # rr = (1, 2, 4, 10)  # resolutions (voxels per cm)
    rr = (1, 2)  # resolutions (voxels per cm)
    lims = tuple(map(lambda x: [0, 24 * x], rr))  # limits
    tt = tuple(map(lambda x: [0, 12 * x, 24 * x], rr))  # ticks

    # User input begin
    spheres = {
        f"resolution_{i + 1}": sphere(resolution=res) for i, res in enumerate(rr)
    }

    aa = Path(__file__)

    # Visualize the elements.
    width, height = 10, 5
    # width, height = 8, 4
    # width, height = 6, 3
    fig = plt.figure(figsize=(width, height))
    fig2 = plt.figure(figsize=(width, height))

    el, az, roll = 63, -110, 0
    VOXEL_ALPHA: Final[float] = 0.9
    CUT_ALPHA: Final[float] = 1.0

    lightsource = LightSource(azdeg=325, altdeg=45)  # azimuth, elevation
    # lightsource = LightSource(azdeg=325, altdeg=90)  # azimuth, elevation
    DPI: Final[int] = 300  # resolution, dots per inch
    SHOW: Final[bool] = True  # turn to True to show the figure on screen
    SAVE: Final[bool] = True  # turn to True to save .png and .npy files

    # Define the custom colormap
    # Define the color mapping
    # 0: transparent (no color), 1: green, 2: yellow
    colors = [
        (1, 1, 1, 0),  # Transparent for segmentation "0"
        (0, 1, 0, 1),  # Green for segmentation "1"
        (1, 1, 0, 1),  # Yellow for segmentation "2"
        (1, 0, 1, 1),  # Magenta for segmentation "3"
    ]
    custom_cmap = ListedColormap(colors)
    # User input end

    N_SUBPLOTS = len(spheres)
    for index, (key, value) in enumerate(spheres.items()):
        if SHOW:
            print(f"index: {index}")
            print(f"key: {key}")
            # print(f"value: {value}")
            ax = fig.add_subplot(1, N_SUBPLOTS, index + 1, projection=Axes3D.name)
            # Create an array for face colors based on the values in the
            # `value` array
            facecolors = np.empty(
                value.shape + (4,), dtype=float
            )  # Shape (x, y, z, 4) for RGBA

            for i in range(value.shape[0]):
                for j in range(value.shape[1]):
                    for k in range(value.shape[2]):
                        facecolors[i, j, k] = colors[value[i, j, k]]

            ax.voxels(
                value,
                facecolors=facecolors,
                # facecolors=colors[3],  # outer shell color
                # edgecolor=colors[3],  # outer shell color
                # edgecolor="black",  # for better visibility
                alpha=VOXEL_ALPHA,
                lightsource=lightsource,
            )
            ax.set_title(key)

            # Set labels for the axes
            ax.set_xlabel("x (voxels)")
            ax.set_ylabel("y (voxels)")
            ax.set_zlabel("z (voxels)")

            ax.set_xticks(ticks=tt[index])
            ax.set_yticks(ticks=tt[index])
            ax.set_zticks(ticks=tt[index])

            ax.set_xlim(lims[index])
            ax.set_ylim(lims[index])
            ax.set_zlim(lims[index])

            # Set the camera view
            ax.set_aspect("equal")
            ax.view_init(elev=el, azim=az, roll=roll)

        if SAVE:  # save the .npy segmentation output
            cc = aa.with_stem("spheres_" + key)
            dd = cc.with_suffix(".npy")
            # Save the data in .npy format
            np.save(dd, value)
            print(f"Saved: {dd}")

    # fig.tight_layout()  # don't use as it clips the x-axis label
    if SHOW:
        plt.show()

        if SAVE:  # save the .png output
            bb = aa.with_suffix(".png")
            fig.savefig(bb, dpi=DPI)
            print(f"Saved: {bb}")

    # Plot along a cutting plane
    if SHOW:
        for index, (key, value) in enumerate(spheres.items()):
            print(f"index: {index}")
            print(f"key: {key}")
            ax2 = fig2.add_subplot(1, N_SUBPLOTS, index + 1)

            # Plot a cutting plane (for example, at the middle of the z-axis)
            plot_cutting_plane(
                ax2,
                key,
                value,
                plane="z",
                index=value.shape[2] // 2,
                cmap=custom_cmap,
                alpha=CUT_ALPHA,
            )

            ax2.set_xticks(ticks=tt[index])
            ax2.set_yticks(ticks=tt[index])

            ax2.set_xlim(lims[index])
            ax2.set_ylim(lims[index])

        plt.show()

        if SAVE:
            # overwrite
            cc = aa.with_stem(aa.stem + "_cut").with_suffix(".png")
            fig2.savefig(cc, dpi=DPI)
            print(f"Saved: {cc}")


if __name__ == "__main__":
    main()